RESOURCES ⇢ ORGANIC GROWTH
Strategy Guide: 85+ KPIs for Business Development Managers
Driving organic growth requires a strategic focus on KPIs that go beyond traditional metrics. This guide covers essential KPIs and emerging trends for your strategies.

“How do I know if my BD strategy is successful?”
It’s an important question to consider.
Some business development managers may rely on gut instincts or the monetary success to determine whether their business development strategy is effective, but that’s not a winning strategy to meet growth targets.
Business KPIs, or key performance indicators, are measurable metrics that provide strategic insights into your business development efforts.
Not setting KPIs is like driving down the road blindfolded.
It’s important to know whether you are heading in the right direction so you can find the best path to avoid obstacles, and successfully reach your destination.

KPIs vary in importance, similar to your car’s dashboard. Some indicators can signal a checkup, while others might cause you to immediately pull over to investigate.
Having KPIs in place is a critical step to gain the analytics you need to maximize your resources and ensure you meet growth targets.
Inside this guide, we’ll cover both traditional and emerging kpis for business development managers and leadership.
But remember, the “right” metrics may not be the same for every organization.
It’s important to find the right KPIs for your business. Let’s get started.
SELECTING THE RIGHT KPIs
Many metrics can be tracked, but which KPIs are best to improve your BD process?
In Change Factory’s article, “Common mistakes with KPIs,“ they identified the 3 most common mistakes business make when selecting KPIs:
- Selecting KPIs that were not actually key performance indicators.
- Choosing too many KPIs.
- Creating KPIs that can’t be measured.
So be selective and make sure you focus your metrics around the business outcomes you want. You can then reevaluate your metrics plan as your business evolves.

When selecting your metrics, it’s helpful to determine whether your KPIs are leading or lagging indicators.
- Leading metrics are predictive of the future.
For example, the probability of a win (Pwin) is a leading indicator of bid submissions. - Lagging metrics are often rear-facing and historical.
A lagging indicator only records what has already happened, while the leading indicator provides data to change your future strategy. For instance, a win percentage is a lagging indicator.
It’s also important to use a combination of quantitative and qualitative indicators.
- Quantitative indicators, like Value of Opportunities by Stage, measure the quantity and provide “hard” data for comparison.
- Qualitative indicators, such as Customer Intimacy, can be trickier to apply, but they help explain why something happened. For example, why your Customer wasn’t as happy with your delivery team as expected. By combining both types, you get a balanced view of your product’s performance.
This guide is not an exhaustive metrics list but an introduction to commonly used KPIs and emerging metrics like CRS high-performing organizations leverage you may want to use as well.
Remember: Often, less is more.
It can be tempting to track many KPIs, but it’s important to narrow your focus to a few key metrics that provide your team the most valuable insights while keeping things simple.
Collaborate with key stakeholders, then select the most impactful KPIs for your organization that you believe can give you the ability to monitor and respond effectively.
TYPES OF KPIS
This article explores a comprehensive array of KPI types—from lead generation and revenue metrics to customer retention, pipeline efficiency, and market expansion.
Most KPI guides focus on a short list of key metrics, but this strategy guide is designed to give you a complete understanding of KPIs available for your custom approach.
As you develop your strategy, keep in mind there is also a metric for business development across an organization.
This is determined by the The Capability Maturity Model® for Business Development (BD-CMM) through an independent assessment, where best practices are rated using a 1-5 scale.
The BD-CMM codifies established industry best practices in business development into a framework that supports maturity growth through well-defined, proven growth paths.
If you’re seeking an objective, external evaluation to establish a baseline maturity level, validate process improvements, benchmark against industry standards, or address strategic challenges like stagnation in win rates, it’s a great option to explore.
THE ROLE OF RELATIONSHIPS
It’s important to note there are many KPIs listed below are affected by your Customer Relationship Score (CRS), which is an important metric to measure and improve for success.
You can have the very best solution on the market, but it simply doesn’t matter if the customer doesn’t like or trust your team. Your customer relationships, often driven by sales and frontline interactions, will drive your customer retention, loyalty, upsells, market expansion and more.
For those metrics in this guide, we will feature the following icon:
★ AFFECTED BY CRS

Although we’ll cover several valuable Customer KPIs in this guide, CRS is the most powerful relationship metric, as it’s designed to measure and improve customer relationships in complex B2B and B2G environments.
If you’re not currently measuring CRS, you’re leaving your customer relationships up to chance. You can’t improve what you don’t measure, and your sales and frontline delivery roles need clarity on what makes a relationship “great” and how to consistently show up in engagements.
RECOMMENDED GUIDE
High-performing organizations use CRS to address gaps in intimacy, ensuring customers view them as valued partners driving increased win rates and organic growth.
Now, let’s begin with booking metrics:
BOOKING METRICS
One of the easiest BD metrics to track is bookings. Bookings are work that has been “won,” whether you have billed against it or not.
The booking is usually recorded when an organization is awarded a contract, and it’s typically broken into billings (what has been billed) and backlog (what is still to be billed).

However, in the Federal market, businesses get multiple award contracts, multi-year contracts, and task order contracts.
So business development typically focuses on “estimated bookings” (i.e., the expected value of the contract throughout their performance.)
CFOs and the financial community generally focus on “funded bookings.” This is especially important in a publicly traded organizations where bookings are most often estimated bookings.
This high-level KPI gauges BD success and measures value or actual vs. target bookings.
In the Federal market, many bookings occur near the end of the Government fiscal year (late September). So, the actual bookings have to be tracked against the forecasted bookings on a monthly or quarterly basis.
Sometimes it’s helpful to check bookings to see where corrective action might be needed. To do this, you might want to assess bookings such as:
- Recompetes vs. New Bids
- Repeat Clients vs. New Clients
- Business Units, Departments, or Functional Areas
- Geographic Locations
- Market Sectors or Client Types
Knowing your current booking metrics can help you make decisions for success in future bookings.
PROFITABILITY METRICS
These are arguably the most critical metrics and are the ultimate measure of your success.
REVENUE AND GROWTH ANALYSIS
★ AFFECTED BY CRS
Net Revenue Growth: This is a method to check your organization’s pulse. Are you growing steadily over time? This metric tells us a lot about its financial health and expansion potential.
Revenue Trends: Are there seasonal ups and downs, or is it fairly consistent? Keeping tabs on these trends helps us adjust to stay on track with our revenue goals.
Top 3 Clients: You want to ensure you’re not overly reliant on a small number of big customers to mitigrate risk.
Budget vs. Actual: Did we hit our revenue targets? Tracking reality versus forecast gives us the power to make changes to maximize income.
CRS enhances revenue and growth analysis by directly linking relationship quality to financial outcomes, enabling organizations to identify which customer relationships drive the highest organic growth. By tracking CRS scores, companies can prioritize efforts that increase win rates.

Businesses need to constantly evaluate how they do business with people. [This training] will create a team enabled to build deep embedded partnerships that provide the business long term, sustainable and desirable results across the organization.
Labor Utilization and Efficiency
Average Billing Rate: This is the actual rate a company makes after considering the hours its team has spent on a project.
Effective Billing Rate: Effective billing rate measures the average rate at which a company bills for its services per billable hour or day.
Utilization Analysis: Utilization rate is a metric that measures the percentage of an employee’s available time that is used for productive, billable work. It’s calculated by dividing the total number of billable hours by the total hours available.

Cost Management and Overhead Analysis
Tracking costs over time paints the best picture of how well we’re managing expenses:
Indirect Rates: These include things like benefits, overhead, and general expenses.
Direct Margin Trend: Are we getting more or less profitable on specific jobs? Looking at this helps us spot problem areas and adjust for profitability.
Wrap Rate: Knowing our fully “loaded” labor cost lets us price jobs accurately
Financial Oversight and Compliance
★ AFFECTED BY CRS
Bid and Proposal Costs: Ideally, these costs stay around 1-2% of our yearly revenue (depending when you start officially tracking them).
Unallowable Costs: The government has rules about what we can’t charge them for. Avoiding these keeps everything above board and boosts your bottom line.
Cost Variance: Did a project go over or under budget? This tells us where to focus to get costs back on track.
Average Days Payable Outstanding (DPO): We need to know how quickly Customers pay as it directly affects your cash flow.
CRS supports financial oversight by fostering trust and transparency with customers, reducing disputes that could lead to compliance issues or financial penalties. Strong relationships, as measured by CRS, ensure smoother contract execution and adherence to terms, indirectly safeguarding revenue stability.
customer acquisition cost (cac)
Customer Acquisition Cost calculates the total expense to acquire a new customer, including marketing and sales costs. It’s used to ensure sustainable growth by balancing acquisition spend with customer value. Business development managers need this KPI to justify investments, focusing on cost-efficient acquisition that supports profitable scaling and long-term financial health.
ltv:cac ratio
★ AFFECTED BY CRS
LTV:CAC Ratio compares Lifetime Value of a customer to the cost of acquiring them. This metric assesses long-term profitability, helping prioritize high-value segments in B2B strategies. For business development managers, it’s indispensable for strategic decision-making, ensuring efforts target customers that yield returns far exceeding costs for sustained business viability.
revenue growth rate
★ AFFECTED BY CRS
Revenue Growth Rate measures the percentage increase in revenue over a period. It indicates business expansion health, guiding investments and forecasting in both B2B and B2G contexts. Business development managers depend on it to demonstrate growth impact, aligning activities with company objectives and securing resources for future initiatives.
ACTIVITY-BASED METRICS
Organizations often try to gauge their success by tracking activity-based metrics, like how many meetings were held or how many emails were sent.
These metrics usually try to identify how often team members are engaging in business communication activities such as:
- Meetings
- Phone Calls
- Emails
- Social Media Activities
- Networking Event Conversations
Activity tracking is used to make sure that those with BD responsibilities are being held accountable and doing the activities that, when done correctly, lead to improved win rates and revenue goals.
An example of an activity-based metric would be “arrange 2 meetings with new prospects per week” or “contact 4 former clients per month.”

Often, having these metrics as KPIs often leads to resentment. Team members feel pressured to meet a set number of activities, and managers feel pressured to micro-manage ensuring those numbers are hit.
Experienced business development professionals understand that it’s not the number of engagements but the quality of engagement that’s important.
Logging a phone call with someone doesn’t mean that the interaction went well, discriminators were found, or even that it improved the Probability of Win (Pwin).
That’s why it’s critical your team uses a customer engagement method.
Organizations are 80% more likely to win with excellent customer engagement (Deltek) and 80% of customers say the experience a company provides is as important as its products and services. (Salesforce State of the Connected Customer)
When your team uses a repeatable engagement method, they will no longer be “winging it” in Customer conversations and will understand how to consistently build trust in every engagement, identify opportunities and bring that intel back home. It’s a critical component of an organization’s growth playbook.
If you decide to track activity-based metrics, you’ll probably want to use Customer Relationship Management (CRM) software to easily track this data.
CRMs can be an avenue to gather data that can be analyzed, but one downside is data input often slips in organizations, impacting the quality and relevance of the data itself.
Although mandatory fields and actions can increase updates and feedback, 91% of CRM data is incomplete and 70% of that data deteriorates and becomes inaccurate annually.
BD AND OPPORTUNITY PIPELINE METRICS
Some of the most important business development KPIs are tied to the Opportunity Pipeline. A pipeline lets you track your opportunities from beginning to end.
The pipeline stages are usually unique depending on the organization, but in the GovCon market, many are aligned with industry best practices, like the Shipley Capture Process.
OPPORTUNITY PIPELINE SIZE
Here, most GovCon organizations look to have a pipeline that’s 3-7x annual revenue needed, with highly effective teams targeting 2x. In 2023, Deltek reported 26% of companies had a 3x target while over 31% targeted 4x.
In most B2B organizations, a 3x -3.5x pipeline is considered standard.
In GovCon this is referred to as a Target Pipeline-to-Win Ratio or Opportunity Pipeline Ratio, while in B2B you’ll hear it often called a Pipeline Coverage Ratio or Forecast Coverage.
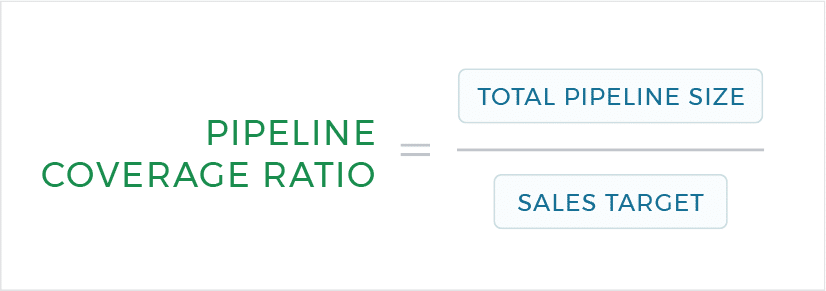
It’s calculated by dividing the total value of opportunities in your pipeline by the revenue (or sales target) for a certain time period. For example, if your pipeline is worth $600,000 and your target is $200,000, the ratio is 3:1 or 3x.
Simply put, the lower your win rates, the larger your pipeline will need to be to hit your growth targets. Some organizations target a Pipeline-to-Win Ratio as high as 10x! An incredible number of resources are wasted this way.
According to Deltek, high-performing teams see 87% win rates on new bids and an 80% win rate on recompetes. If you’re not seeing these win rates in your organization, it’s likely your Target Pipeline-to-Win Ratio is much higher and you’re wasting more resources vs. your competitors.
Other metrics can be used to measure the effectiveness of the entire pipeline, e.g., the Total Value of Qualified vs. Unqualified Opportunities.
While others can be used to measure specific stages, e.g., Value of Opportunities by Stage or identify the ratio between certain stages—e.g., Early Engagement vs. Win Ratio.
AVERAGE SIZE OF OPPORTUNITY IDENTIFIED
The Average Size of Opportunity Identified helps you understand the pipeline make-up and the number of opportunities that are needed to achieve the desired goals.
An example would be measuring the difference between large deals or task orders and the level of effort required from BD, capture, and proposals to win.
The pipeline timeline would also be a factor—task orders may result in bookings relatively quickly, while a Cat 1 acquisition may take many years.
PIPELINE VELOCITY
Pipeline Velocity is a KPI used by mature business development organizations to measure the speed that opportunities pass through the pipeline.
So it’s a measure of successfully moving opportunities from identification to fully qualified to solutioning, proposal writing, and finally to award.

The formula for calculating pipeline velocity is: Qualified Opportunities (Lookback Period) x Average Contract Value x Win Rate (Lookback Period) / Sales Cycle Length / Lookback Period (Duration).
The time that opportunities go through the pipeline vary. Some task order contract awards can take a few weeks, yet others may take a few months—or even years. So this formula can be modified to fit the needs of your business, but make sure you decide on a consistent method for measuring it across your organization.
VALUE OF OPPORTUNITIES BY STAGE
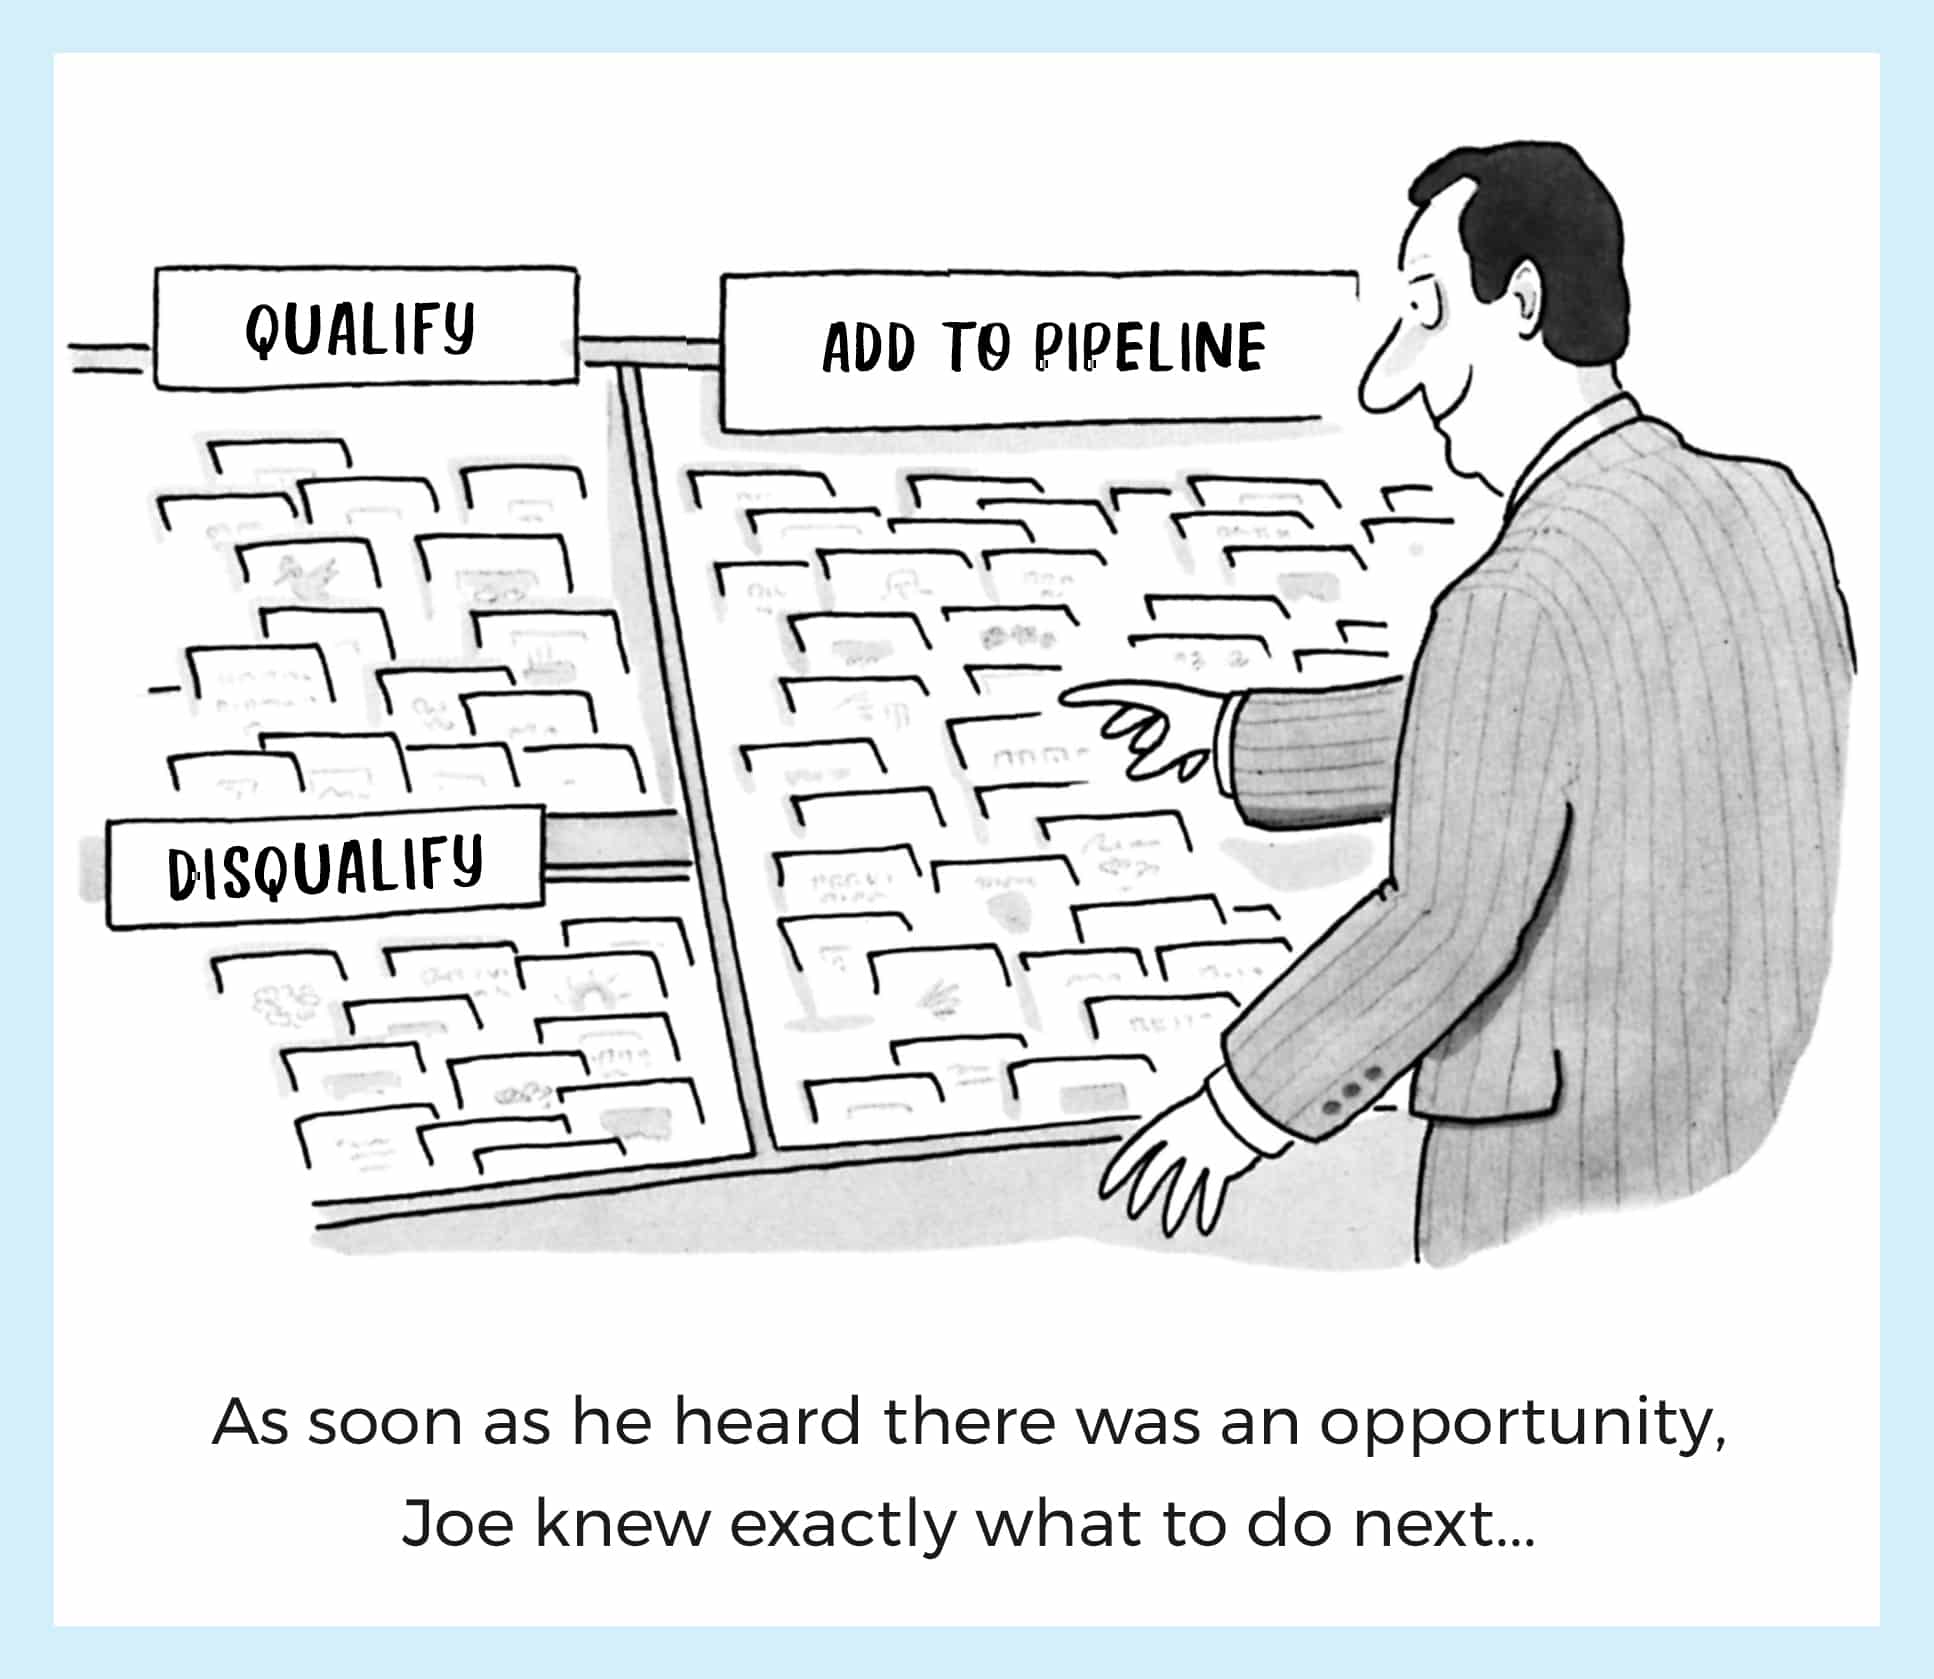
It’s important to track efficiency. You can expect some opportunities to be disqualified as you move through the process.
Some will be disqualified because the requirement was canceled, others will be disqualified because you didn’t have great customer communications throughout the process, and some because you can’t find the right partners.
Over time you should know the rate for opportunities moving through your pipeline. Remember, the better screenings you do early on, the less time you’ll waste on poorly qualified leads.
QUALIFIED VS. UNQUALIFIED PIPELINE
★ AFFECTED BY CRS
This takes us to the next metric, which is the Qualified vs. Unqualified Pipeline.
Most organizations have their definitions for what qualified means.
Still, in most cases, it’s an opportunity where the customer has a funded need, and someone from your organization has engaged with them to figure out if they’re qualified to be a future client.
This qualified vs. unqualified metric is often used at a stage level.
For example, in the early stages, you would expect the ratio of unqualified to qualified to be high. Later on in the process, you might expect zero unqualified opportunities.

According to a 2024 Deltek survey, 81% of business development teams ranked “more or better opportunity identification” as their most important initiative for the year. While 67% of respondents noted they wanted to focus on a better understanding their company’s fit against requirements to assess best-fit opportunities earlier in the process.
This trend is understandable, as many organizations realize there is incredible waste in poor opportunity identification.
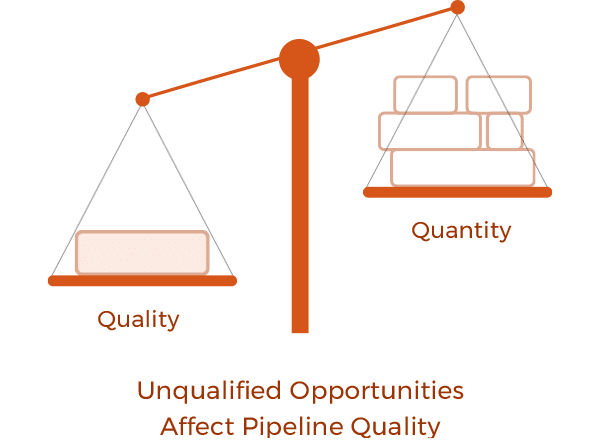
Deltek notes that top-performing teams value opportunity identification more highly (48% vs. 31%) and select fewer sources for new opportunities, indicating they are more effective by focusing on their best opportunities.
Sounds simple. But the reality is many teams don’t have the necessary people skills to connect and ask the right questions to determine if there is a good fit, all while feeling the pressure to add more opportunities to the pipeline.
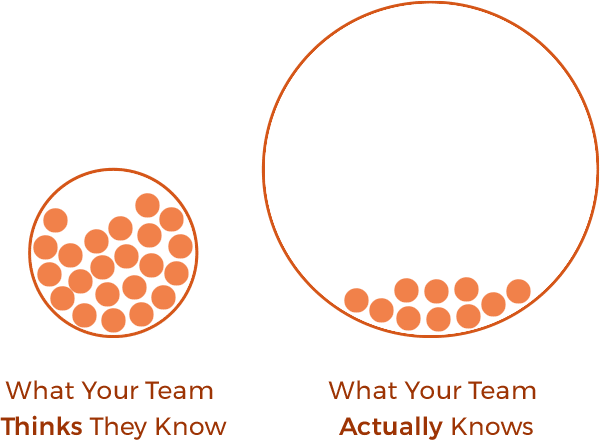
Business development professionals often struggle to get face-to-face opportunities with decision makers, and when they do, they often ask the same questions their competition is asking.
They may even have frontline personnel with easy access to Customers and Stakeholders, but as they have never been trained to gather intelligence and identify opportunities, they miss out on ways to increase their on-contract, recompete and new business growth.
Customer Relationship Score (CRS) has a significant impact on pipeline qualification by identifying high-trust relationships that are more likely to convert, ensuring resources are focused on qualified opportunities. This strategic alignment, a core CRS component, reduces unqualified leads, streamlining sales efforts and boosting overall pipeline efficiency.
LEAD CONVERSTION RATE
★ AFFECTED BY CRS
Lead Conversion Rate tracks the percentage of leads progressing from marketing-qualified to sales-qualified stages. It’s essential for identifying bottlenecks and improving alignment between marketing and sales teams. Business development managers use this to optimize funnel efficiency, ensuring smoother transitions that accelerate revenue opportunities and reduce lost prospects.
SALES CYCLE LENGTH
★ AFFECTED BY CRS
Sales Cycle Length measures the average time from initial contact to deal closure. This KPI helps pinpoint delays in the pipeline, enabling strategies to accelerate deals and boost revenue velocity. It’s important for business development managers as it reveals process inefficiencies, guiding interventions to shorten cycles and capitalize on market opportunities faster.
CONVERSION RATE
★ AFFECTED BY CRS
Conversion Rate (Overall Leads to Customers) calculates the percentage of leads that become paying customers. It assesses end-to-end sales effectiveness, guiding optimizations for higher win rates in competitive markets. For business development managers, this KPI is key to evaluating overall strategy success, informing adjustments that enhance closing rates and drive business expansion.
NEW VS. RECOMPETE OPPORTUNITIES
This is a growth strategy for Government Contracting organizations expanding into new agencies and adjacent markets.
NEW VS. RECOMPETE OPPORTUNITIES
This is a growth strategy for Government Contracting organizations expanding into new agencies and adjacent markets.
The Value of New vs. Recompete Opportunities must reflect this focus. This is where you compare new opportunity value vs. recompete opportunity value.
The value can be potential revenue, strategic positioning of the company, future growth opportunities, and other forward-looking metrics.
The following pipeline metrics should also be considered:
- Value of Opportunities Added Over a Period of Time
- Active Opportunities by Stage, Priority, Lead, Customer, etc.
- Opportunity Pass/Fail Rate by Stage Gate/Review
- Bid Rate by the Customer, Type of Opportunity, and Pursuit Size
- Change Order Win Rates
- Percentage Prime Contracts vs Percentage Sub-Contracts
- Change in Federal Contracts
- Change in IDIQ Revenue
- Retention Rate for Incumbent Recompetes
If a significant portion of your growth targets rely on recompetes, it’s important to be proactive as a recompete loss often surprises leaders. Incumbency no longer guarantees success in this competitive market. We often receive calls from frustrated leaders after they lost a recompete they were sure they would win.
Although the average win rate of recompetes is 58%, high-performing teams have an average win rate of 80% according to Deltek’s latest Clarity report.
QUANTITY AND QUALITY OF CUSTOMER INTELLIGENCE
★ AFFECTED BY CRS
This is a subjective metric, but often organizations will assess the level of customer intelligence during their post-award debriefs and lessons-learned sessions.
Effective business development (BD) personnel are accountable for developing relationships, gathering customer information, and shaping the customer’s thinking.
RECOMMENDED GUIDE
CRS increases both the quantity and quality of customer intelligence by encouraging regular, trust-based interactions that yield deeper insights into customer needs and priorities. This actionable data, derived from CRS assessments, helps teams better understand strategic drivers.
RETURN ON BD INVESTMENT
★ AFFECTED BY CRS
This is calculated as the value of new bookings/ revenue generated from BD investment divided by the dollars invested in BD efforts to win the business.
CRS boosts return on business development (BD) investment by guiding BD teams to focus on high-CRS relationships that yield higher win probabilities, maximizing resource efficiency.
RETENTION RATE OF BD PERSONNEL
★ AFFECTED BY CRS
This non-financial metric measures the percent of current BD personnel retained annually. This calculation usually excludes personnel removed or reassigned for non-performance or legal reasons.
Retaining top talent remains the top challenge for many BD organizations as skilled BD professionals are limited and employee expectations have increased. This has pressured companies to focus on developing the talent they have and provide support for initiatives such as hybrid working models and development programs.

According to the Workplace Learning Report survey 94% of employees would stay longer if their company invested in their skills, and Deloitte reported organizations with strong learning culture see 30-50% higher retention and engagement rates. So it’s no surprise leading organizations have training included in their employee retention strategy as turnover is incredibly expensive.
Relationships can also play a significant role in your retention rate, as it affects how your personnel feel about their Customers, colleagues, leaders, and work in general.
There are various types of turnover issues to be sure, but employees that feel they work in a positive, supportive and engaging environment are much less likely to go elsewhere and bring their organization a 21% higher profitability.
REVENUE GENERATION METRICS
The following metrics focus on tracking the direct income produced through sales activities, providing insights into short-term financial performance and trends.
These KPIs are essential for business development managers to monitor revenue streams, enabling quick adjustments to strategies in fluctuating markets.
Average Deal Size
★ AFFECTED BY CRS
Average Deal Size calculates the typical value of closed sales over a period. It’s used to identify trends in deal quality and guide pricing or bundling strategies. For business development managers, this KPI is essential for targeting higher-value opportunities, optimizing resource allocation to maximize revenue per effort and improve overall profitability.
Monthly/Quarterly Sales Revenue
★ AFFECTED BY CRS
Monthly/Quarterly Sales Revenue tracks total income from sales in short-term periods. It provides timely insights into performance trends, aiding agile adjustments in dynamic markets. Business development managers track this closely to monitor immediate impact, enabling quick pivots in strategy to meet targets and respond to market shifts effectively.
New Business Revenue
★ AFFECTED BY CRS
New Business Revenue measures the income generated from first-time customers or new deals. It’s used to evaluate the success of acquisition efforts in expanding the customer base. For business development managers, this KPI is important as it highlights the effectiveness of prospecting strategies, driving focus on innovative approaches to secure fresh revenue streams and fuel company growth.
repeat Business Revenue
★ AFFECTED BY CRS
Repeat Business Revenue tracks income from existing clients through reorders, renewals, or expansions. This metric assesses the strength of customer relationships and loyalty programs. Business development managers rely on it to balance new acquisitions with retention, ensuring stable income and reducing the pressure of constant prospecting for sustainability.
LEAD GENERATION METRICS
Lead Generation Metrics evaluate the effectiveness of efforts to attract and qualify potential customers at the top of the sales funnel. They help business development managers assess the volume, cost, and quality of leads, ensuring a steady pipeline to support sustained growth.
Cost per Lead (CPL)
Cost per Lead measures the total cost of generating a single lead through marketing efforts. It’s used to evaluate the efficiency of lead generation campaigns and optimize budget allocation for better ROI in B2B sales funnels. For a business development manager, this KPI is crucial as it highlights cost-effective strategies to acquire prospects, ensuring resources are focused on high-impact channels to drive sustainable growth.
Number of Marketing Qualified Leads (MQLs)
Number of Marketing Qualified Leads tracks leads that meet marketing criteria for interest and fit. This KPI helps assess marketing effectiveness in nurturing prospects ready for sales handoff in B2B environments. Business development managers rely on it to gauge the quality of incoming leads, enabling better alignment with sales teams and prioritizing efforts on leads with higher conversion potential.
Number of Sales Qualified Leads (SQLs)
Number of Sales Qualified Leads counts leads vetted by sales as ready for engagement. It gauges the quality of leads transitioning from marketing, supporting pipeline health and conversion forecasting. It’s vital for business development managers to monitor this, as it directly impacts pipeline velocity and helps identify qualification gaps that could hinder deal progression.
Number of Leads Generated
Number of Leads Generated quantifies total prospects captured through various channels over a period. This metric evaluates the volume and reach of lead generation strategies to fuel B2B growth. For business development managers, it’s essential for assessing outreach scale, allowing them to adjust tactics to maintain a robust pipeline and meet expansion targets.
MARKET EXPANSION METRICS
Market Expansion Metrics measure the success of entering new segments, geographies, or industries to broaden the company’s reach. For business development managers, these KPIs are key to evaluating diversification strategies and identifying opportunities for scalable, long-term expansion.
New Market Penetration
★ AFFECTED BY CRS
New Market Penetration measures entry success into untapped segments or geographies. This KPI evaluates expansion strategies, supporting diversification and scalable growth initiatives. It’s important for business development managers as it tracks bold moves into new areas, validating risk-taking and opening avenues for broader revenue diversification beyond core markets.
Revenue from New Markets
★ AFFECTED BY CRS
Revenue from New Markets quantifies income generated from recently entered segments or regions. This metric assesses the financial viability of expansion initiatives. Business development managers use it to justify market entry investments, measuring ROI on diversification efforts and guiding future scaling decisions for long-term competitiveness.
Number of New Markets/Segments Entered
Number of New Markets/Segments Entered counts the distinct new industries, geographies, or customer types targeted and accessed. It’s used to track the breadth of expansion activities. For business development managers, this KPI is crucial for evaluating strategic agility, ensuring proactive diversification that mitigates risks from over-reliance on existing markets.
SALES PERFORMANCE METRICS
The following metrics assess how well sales teams and individuals meet their targets and contribute to overall goals. Business development managers use these to drive accountability, optimize team efforts, and align performance with organizational objectives for consistent results.
Quota Attainment
★ AFFECTED BY CRS
Quota Attainment measures the percentage of sales targets achieved by individuals or teams. This KPI evaluates performance against goals, informing coaching and incentive programs to drive consistent results. It’s critical for business development managers to track this, as it measures team productivity and personal accountability, directly influencing revenue goals and career progression.
Pipeline Velocity
★ AFFECTED BY CRS
Pipeline Velocity calculates the speed at which opportunities move through the sales funnel to closure. This metric helps forecast revenue and identify acceleration opportunities. Business development managers depend on it to enhance efficiency, shortening cycles to increase throughput and respond faster to market demands for competitive advantage.
Hit Rate
★ AFFECTED BY CRS
Hit Rate measures the percentage of qualified opportunities that convert to wins. It’s used to assess the quality of pursuits and sales tactics. For business development managers, this KPI is vital for refining targeting, focusing efforts on high-potential deals to improve win probabilities and resource utilization.
Revenue per Sales Rep
★ AFFECTED BY CRS
Revenue per Sales Rep tracks the total income generated by each salesperson or team member. This metric evaluates individual productivity and contribution to goals. Business development managers leverage it to identify top performers, allocate support effectively, and drive equitable performance across the team for optimized results.
PARTNERSHIP METRICS
The next set of metrics track the formation and value of strategic alliances that extend business capabilities and revenue potential.
These are crucial for business development managers to quantify collaboration impacts, fostering relationships that unlock new markets and shared growth opportunities.
Number of Strategic Partnerships Formed
★ AFFECTED BY CRS
Number of Strategic Partnerships Formed counts alliances built with key partners. It measures collaboration efforts, unlocking new opportunities and revenue channels in B2B ecosystems. Business development managers focus on this to expand reach indirectly, leveraging partnerships for co-selling, innovation, and entry into new markets without solo investment.
Revenue from Partnerships
★ AFFECTED BY CRS
Revenue from Partnerships quantifies income generated through collaborative alliances. This KPI assesses partnership ROI, guiding selections that amplify growth and market access. For business development managers, it’s vital as it quantifies alliance value, justifying partnership pursuits that contribute to diversified revenue and reduced dependency on direct sales.
DIVERSIFICATION METRICS
Diversification is a key metric with companies focused on acquiring new customers (agencies), gaining access to new markets, and offering new product lines to their customers.
MARKET SHARE GROWTH
★ AFFECTED BY CRS
Market Share Growth tracks increases in a company’s portion of the total market. This KPI evaluates competitive positioning, informing strategies for expansion and dominance in target sectors. It’s crucial for business development managers to pursue this, as it measures penetration success and guides competitive tactics to outpace rivals and secure larger revenue shares.
DIVERSIFICATION INTO NEW CUSTOMERS
This is the percentage of this year’s revenue from new customers.
DIVERSIFICATION INTO NEW MARKETS
This is the percentage of this year’s revenue from new markets.
DIVERSIFICATION INTO NEW PRODUCTS
This is the percentage of this year’s revenue from new products.
CUSTOMER KPIS
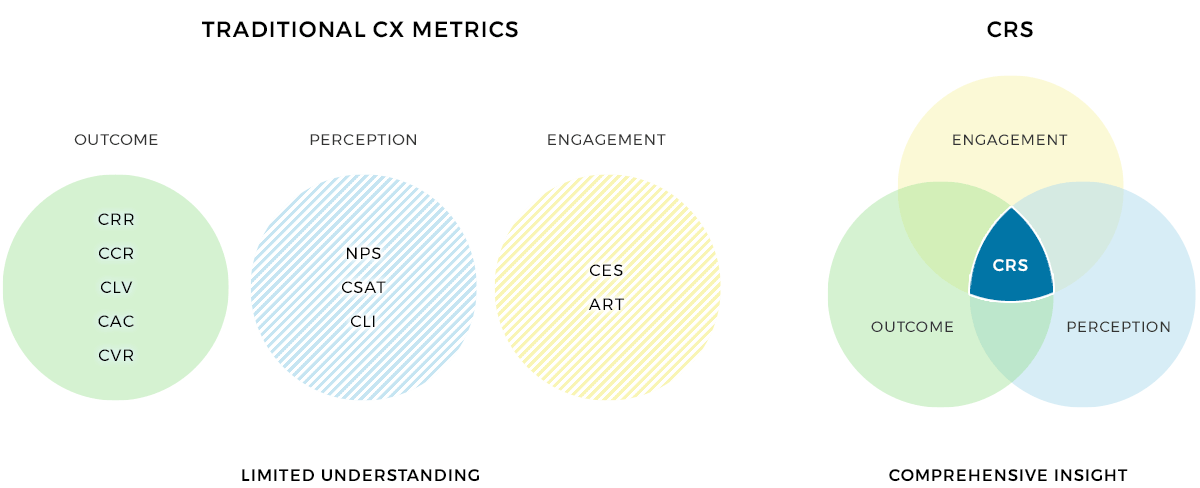
Previously, leaders defaulted to CSAT, CES, CHS, and NPS as primary customer KPIs, but these metrics, while valuable, have limitations in both B2B and B2G contexts where long-term relationships, revenue impact, and strategic alignment are critical.
CSAT focuses on short-term satisfaction, CES on transactional ease, and NPS on loyalty prediction, but they often fail to capture the depth of customer relationships or their direct financial outcomes.
High-performing companies are now expanding their customer KPIs to bridge this gap.
Customer Relationship Score (CRS), with its focus on trust, emotional connection, and strategic alignment, addresses these gaps by linking relationship quality to win rates and organic growth, making it a top KPI for leadership, along with others listed below.
However, traditional customer KPIs are equally critical for a holistic view, especially for top leaders aiming to balance customer experience with business outcomes.
Let’s cover both traditional and emerging KPIs:
CUSTOMER LIFETIME VALUE (CLV)
★ AFFECTED BY CRS
NET PROMOTER SCORE (NPS)
★ AFFECTED BY CRS
CUSTOMER RELATIONSHIP SCORE (CRS)
CRS is a new customer KPI measuring trust, emotional connection and strategic alignment. It’s a top KPI for B2B and B2G leaders as it drives actionable, revenue-focused relationship strategies, unlike the more limited scope of traditional metrics.
Read our guide to learn how you can measure, track, and incorporate CRS into your processes.
Customer Relationship Score (CRS)
A measure of trust, emotional connection, and strategic alignment between employees and customers, assessed by those with customer access, like business developers or delivery teams, to boost win probability (PWin) and guide deeper relationships.
CUSTOMER RETENTION RATE
★ AFFECTED BY CRS
ON-CONTRACT GROWTH
★ AFFECTED BY CRS
CUSTOMER SATISFACTION SCORE (CSAT)
★ AFFECTED BY CRS
CUSTOMER EFFORT SCORE (CES)
★ AFFECTED BY CRS
CHURN RATE
★ AFFECTED BY CRS
Churn Rate tracks the percentage of customers lost over a period. This KPI highlights retention issues, enabling strategies to improve loyalty and reduce revenue leakage in ongoing relationships. It’s important for business development managers as it signals relationship management effectiveness, prompting actions to retain accounts and protect recurring revenue streams.
UPSELL/CROSS-SELL RATE
★ AFFECTED BY CRS
Upsell/Cross-sell Rate measures the percentage of existing customers purchasing additional products or upgrades. It drives revenue from current accounts, maximizing lifetime value in B2B models. Business development managers value this for uncovering expansion opportunities within the base, reducing reliance on new acquisitions and boosting overall profitability.
CLIENT RETENTION RATE
★ AFFECTED BY CRS
Client Retention Rate calculates the percentage of clients retained over time. This metric underscores relationship strength, supporting efforts to foster loyalty and sustain long-term revenue streams. For business development managers, it’s essential to monitor as high retention validates nurturing strategies, freeing up time for new pursuits while stabilizing income.
CUSTOMER SATISFACTION SCORE (CSAT)
★ AFFECTED BY CRS
Customer Satisfaction Score gauges client happiness through post-interaction surveys. It’s used to identify service gaps, enhancing retention and referrals in B2B and B2G engagements. Business development managers use this to refine client interactions, as satisfied customers lead to repeat business, positive word-of-mouth, and stronger market positioning.
REFERRAL RATE
★ AFFECTED BY CRS
CAPTURE & PROPOSAL METRICS
Knowing the most important KPIs that impact your capture efforts can help you identify new opportunities to capture and help prioritize your business development and capture resources.
PROBABILITY OF GO (P-GO)
Evaluates the likelihood a customer will fund and execute a project.
PROBABILITY OF WIN (PWIN)
★ AFFECTED BY CRS
Pwin measures various win factors to assess the possibility of winning an opportunity.
It is often reported by relative probability (low, medium, high) or by percentage.
P-Go and Pwin metrics can be tricky because they are typically subjective and the calculation process can vary greatly from business to business.
Many organizations use a combination of methods to determine their Pwin, which could be based on various evaluation criteria such as the stages of the opportunity, weighted questions such as relationship quality, or even KPIs.

You Pwin is only as accurate as your assumptions, and most teams overestimate their probability of win significantly as they have an overly optimistic view of their capabilities and Customer Relationship Score (CRS).
Added to this, many BD and Capture managers feel pressured to use assumptions that generally favor their organization, resulting in meaningless calculations.
Ultimately, Pwin cannot paint an accurate picture of your chances unless you understand the opportunity from the Customer’s perspective and your team has deep knowledge of their real problems, how your solution might help them, and your competitors.
This is why organizations that excel in customer engagement are 80% more likely to win competitive bids.
SOURCE: 2023 Deltek Clarity Report
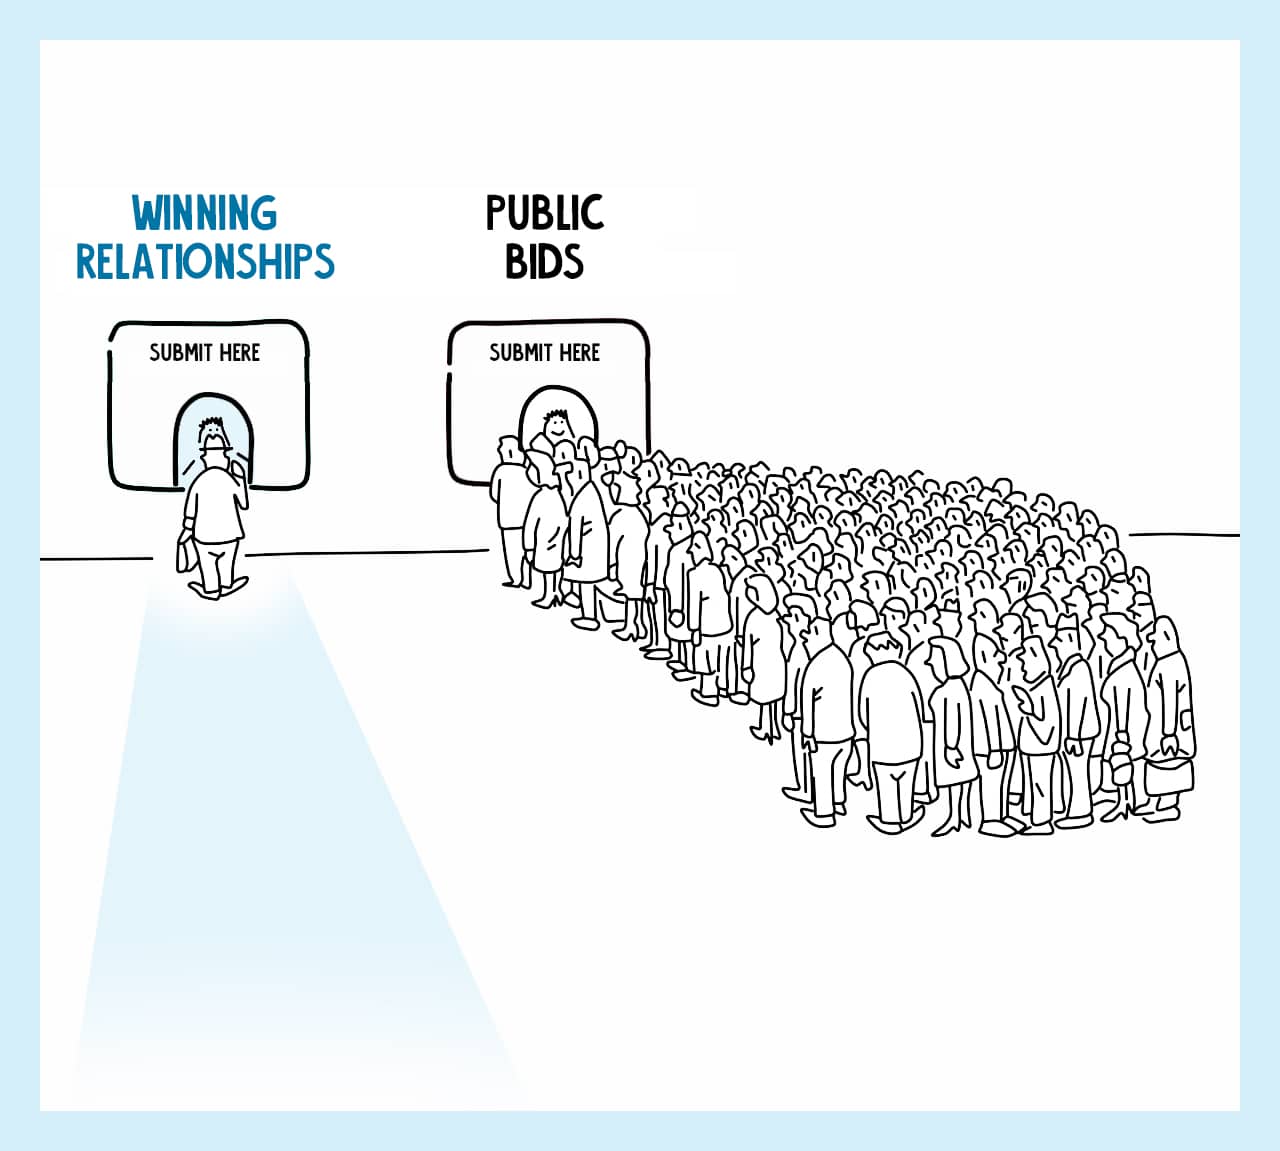
Winning Relationships™ are absolutely critical to win in both the B2G and B2B competitive landscapes. Salesforce reported 82% of government decision-makers say strong relationships are a key factor in awarding contracts, and 84% of B2B buyers begin their buying process with a referral according to Harvard Business Review.
If you would like to learn more on how to calculate Pwin, check out this article from William Rogers.
Other standard lagging capture metrics include:
CAPTURE RATE
★ AFFECTED BY CRS
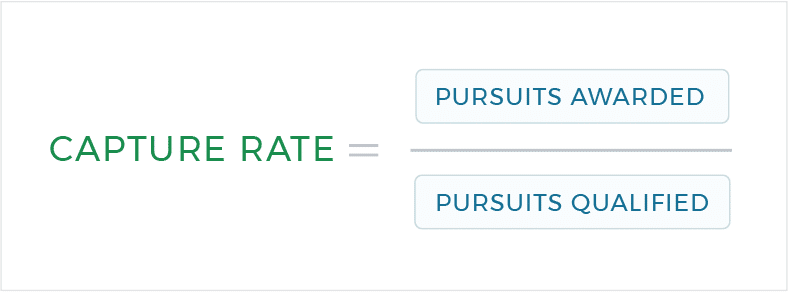
Capture Ratio is calculated by: Pursuits Awarded / Pursuits Qualified.
CRS enhances capture rate by focusing efforts on relationships with high trust and collaboration, increasing the likelihood of winning competitive bids. By aligning BD strategies with CRS scores, organizations can improve capture success.
CAPTURE RATIO (WIN RATIO)
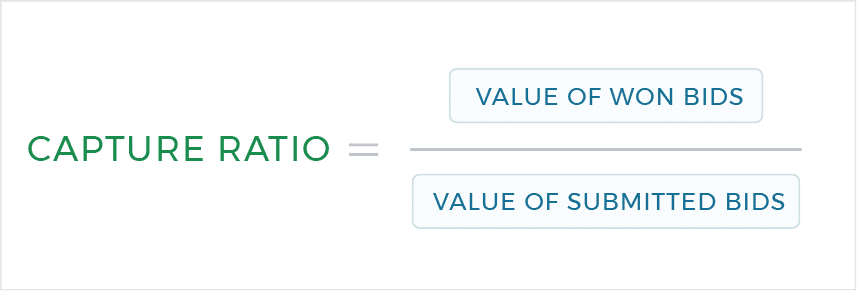
Capture Ratio (Win Ratio) is calculated by: Percentage of Dollars Won / Value of All Bids Submitted.
However, often the real insights are found in determining the following:
SUBMISSION BY PROPOSAL TYPE
Fixed Price, Time & Materials, Cost Reimbursable/Plus, ID/IQ.
SUBMISSION BY SELECTION TYPE
Sole Source, Competitive, Negotiated, Prequalified, Set Aside.
SUBMISSIONS BY CAPABILITY
Opportunity submissions grouped by the organization’s capabilities.
SUBMISSIONS TO EXISTING VS. NEW CUSTOMER
Opportunity submissions sorted by existing vs. new accounts.
PROJECT EXECUTION
★ AFFECTED BY CRS
Your team says they are doing a great job on the contract and the customer is happy with their performance, but you cannot substantiate these claims.
In BD and proposal terminology, we call these proof points. They are invaluable, if not essential, to every declarative statement you make in your proposal.
RECOMMENDED READING
Monitoring key project execution metrics ensures you are ahead of recompetes. If a project is struggling, you can take the correct action to ensure it won’t negatively impact future opportunities where you might need that project as past performance.
Here are some metrics you could track:
- Client Satisfaction
- Cost Variance
- Change Order Win Rates
- Employee Retention
- Earned Value Management
- Lead Times: Hired to Billable
- On-Time Delivery
- On-Contract Growth
- Schedule Variance
- Time to Fill Positions
👋 Read the rest of this guide:
Liked this so far? Enter your email below to instantly receive our KPIs guide.
OUR KPI GUIDE COVERS:
How to Select Your KPIs
Profitability Metrics
Customer KPIs
BD & Opportunity Pipeline Metrics
Capture & Proposal Metrics
Project Execution
Win Rates
Calculators + Formulas
and much more!
3 Year Growth Calculator
Form not working? Email us.
PROJECT EXECUTION
Enter your email above to receive the full guide with over 70 KPIs.

FREQUENTLY ASKED QUESTIONS
WHAT IS A KPI FOR BUSINESS DEVELOPMENT?
A Key Performance Indicator (KPI) for business development is a measurable value that shows how well a company is growing, acquiring customers, and building partnerships. An example is sales revenue growth, which tracks increases in sales over time, helping businesses gauge their expansion success.
In B2B, where relationships drive outcomes, Hi-Q Group’s Customer Relationship Score (CRS) is a valuable KPI, measuring trust and alignment to predict customer loyalty and business success.
WHAT ARE THE TOP 3 SKILLS FOR A BUSINESS DEVELOPMENT MANAGER?
Business development managers need strong skills to drive growth:
- Communication: Clear communication builds trust and conveys value to clients, ensuring effective pitches and negotiations.
- Strategic Thinking: Identifying market opportunities and aligning sales strategies with business goals boosts revenue and market share.
- Relationship Building: Creating lasting client relationships through relationship-based sales fosters loyalty and repeat business, critical for B2B success.
WHAT ARE THE 5 KEY PERFORMANCE INDICATORS FOR MANAGERS?
Managers use these performance metrics to track success:
- Net Profit: Measures overall profitability, reflecting financial health.
- Revenue Growth: Tracks sales increases, showing business expansion.
- Customer Retention Rate: Indicates customer loyalty and satisfaction, while minimizing customer churn.
- Employee Productivity: Assesses team efficiency, like sales performance per employee.
- Customer Lifetime Value (CLV): Estimates long-term customer value, guiding retention efforts.
HOW DO YOU MEASURE SUCCESS IN BUSINESS DEVELOPMENT?
Success in business development is measured by tracking sales revenue growth, customer acquisition through the sales pipeline, customer retention rates, and strategic achievements like new strategic partnerships. Metrics like customer lifetime value and net promoter score (NPS) provide insights into customer value and satisfaction. CRS enhances this by assessing trust and alignment, ensuring stronger relationships that drive growth.
WHAT ARE BUSINESS DEVELOPMENT KPI EXAMPLES?
Examples include:
-
Revenue Growth: Tracks sales increases.
-
Customer Acquisition Cost (CAC): Measures cost of gaining customers through the sales process.
-
Customer Lifetime Value (CLV): Estimates customer value over time.
-
Customer Retention Rate: Shows loyalty and customer retention rates.
-
Net Promoter Score (NPS): Gauges customer advocacy and customer interest.
Customer Relationship Score (CRS) adds depth by measuring relationship strength, predicting retention and expansion.
WHAT IS A KPI BUSINESS DEVELOPMENT FRAMEWORK?
A KPI business development framework is a structured approach to selecting and tracking KPIs like revenue growth, CAC, and CLV to align with business strategy. It involves understanding the business’s market share, setting objectives for opportunity creation, and monitoring progress toward expansion revenue. CRS fits into this framework by providing insights into relationship quality, enhancing strategic decisions.
WHAT ARE THE TOP KPIS IN A B2B BUSINESS DEVELOPMENT DASHBOARD?
A B2B dashboard should include:
-
Revenue Growth: Tracks sales growth.
-
Customer Acquisition Cost (CAC): Measures acquisition efficiency.
-
Customer Lifetime Value (CLV): Estimates long-term value.
-
Customer Retention Rate: Reflects loyalty.
-
Customer Relationship Score (CRS): Assesses trust and alignment, predicting future success.
These KPIs help inform sales strategies and optimize the sales process for better outcomes.
what are the top kpis for saas business development?
SaaS business development managers focus on scalable growth, where tracking the right KPIs ensures alignment with business goals and drives revenue generation. From Hi-Q Group’s perspective, these top KPIs provide a comprehensive view of performance:
- Revenue Growth Rate: Measures the percentage increase in revenue over time, reflecting the effectiveness of sales processes and market expansion.
- Sales Pipeline Velocity: Tracks how quickly deals move through the sales pipeline, helping identify bottlenecks in the sales process.
- Customer Acquisition Cost (CAC): Calculates the cost to acquire new customers, ensuring efficient business strategies for scaling.
- Customer Lifetime Value (CLV): Estimates the total revenue from a customer, guiding investments in retention and upselling.
- Customer Churn Rate: Monitors the rate at which customers leave, highlighting issues in product fit or support.
- Customer Relationship Score (CRS): Hi-Q Group’s CRS assesses trust and alignment in client relationships, predicting loyalty and reducing churn in SaaS environments.
These KPIs, when monitored via data analytics, support organizational goals like sustainable scaling, with CRS adding relational depth to traditional metrics.
what are the top kpis a b2b service business manager should track?
B2B service managers prioritize relationship-driven growth, where KPIs must balance revenue growth rate with long-term client value. Hi-Q Group recommends these top KPIs for comprehensive oversight:
- Client Retention Rate: Tracks the percentage of clients retained, essential for maintaining a stable customer base and minimizing customer churn.
- Revenue Growth Rate: Measures year-over-year revenue increases, indicating success in service expansion and upselling.
- Sales Pipeline Velocity: Evaluates the speed of deals progressing through stages, optimizing sales operations for efficiency.
- Strategic Partnerships Formed: Counts new alliances, fostering collaborative opportunities that align with business goals.
- Customer Relationship Score (CRS): Hi-Q Group’s CRS quantifies relationship quality, helping managers nurture trust and predict repeat business.
- Net Promoter Score (NPS): Gauges client advocacy, supporting strategic plan adjustments for better satisfaction.
Using data source tools like CRM systems ensures data accuracy, enabling managers to refine team’s performance and achieve sustainable growth.
what are the top kpis for government contracting managers?
Government contracting managers navigate regulated environments, where KPIs focus on compliance, bid success, and contract stability.
- Win Rate: Measures the percentage of bids won, reflecting business development teams’ effectiveness in competitive landscapes.
- Contract Value Growth: Tracks increases in awarded contract values, supporting strategic partnerships with agencies.
- Bid Submission Rate: Monitors the number of proposals submitted, aligning with sales trends and opportunity pursuit.
- Past Performance Rating: Evaluates feedback from previous contracts, crucial for future eligibility.
- Customer Relationship Score (CRS): Hi-Q Group’s CRS gauges trust with government stakeholders, predicting retention in long-term deals.
- Pipeline Health: Assesses the quality of upcoming opportunities, ensuring alignment with organizational goals.
These KPIs, informed by data analytics, help managers adapt to policy changes and secure reliable revenue streams.
what are the most overlooked kpis in b2b business development?
In B2B business development, overlooked KPIs often relate to relational and operational nuances, leading to missed opportunities.
- Sales Pipeline Velocity: Measures deal progression speed, revealing inefficiencies in sales processes that affect closing times.
- Client Retention Rate: Tracks loyalty beyond acquisition, preventing overfocus on new leads while ignoring existing revenue.
- Customer Relationship Score (CRS): Hi-Q Group’s CRS evaluates trust and alignment, frequently overlooked despite its impact on repeat business.
- Lead Conversion Rate: Assesses the percentage of leads turning into clients, highlighting gaps in qualification.
- Cross-Sell/Upsell Rate: Monitors additional sales to current clients, supporting revenue generation from the customer base.
These KPIs, when integrated into a strategic plan, enhance team’s performance and reveal hidden growth potential.


